NutrEval® FMV
A Comprehensive Test for Identifying Functional Nutritional Deficiencies and Insufficiencies
Featuring Urine Amino Acid Analysis
Why Use the NutrEval FMV Profile?
The NutrEval FMV® is both a blood and urine test that evaluates over 125 biomarkers and assesses the body's functional need for 40 antioxidants, vitamins, minerals, essential fatty acids, amino acids, digestive support, and other select nutrients. Personalized recommendations for nutrients are determined by using an algorithm based on the patient's test findings. The NutrEval Plasma and NutrEval FMV (first morning void) differ based on which sample type is used to measure amino acids, plasma or urine.

NutrEval is the most comprehensive functional and nutritional assessment available. It is designed to help practitioners identify root causes of dysfunction and provide a systems-based approach to help patients overcome chronic conditions and live a healthier life.
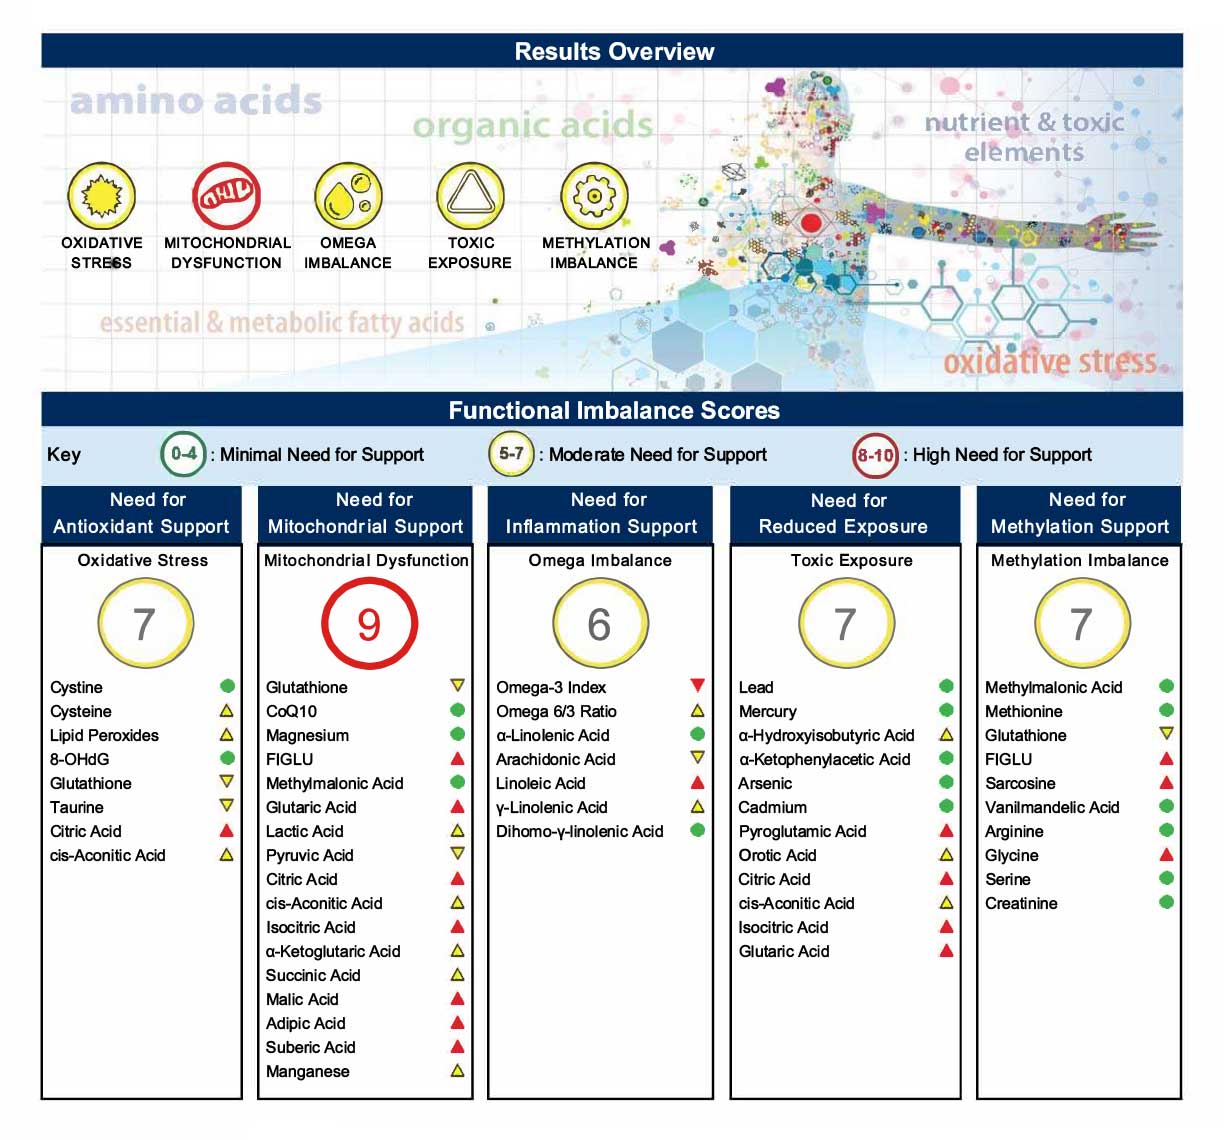
The NutrEval report offers:
- Nutrient recommendations for key vitamins, minerals, amino acids, fatty acids, and digestive support
- Functional pillars with a built-in scoring system to guide therapy around needs for methylation support, toxic exposures, mitochondrial dysfunction, fatty acid imbalances, and oxidative stress
- Interpretation-At-A-Glance pages for patient education
- Dynamic biochemical pathway charts for clearer understanding
When should testing for NutrEval FMV be considered?
According to the World Health Organization, every country in the world is affected by one or more forms of malnutrition. The term malnutrition addresses 3 broad groups of conditions:1
- Undernutrition (wasting, stunting, underweight)
- Micronutrient-related malnutrition from inadequate or excess vitamins or minerals
- Overweight, obesity, and diet-related noncommunicable diseases (such as heart disease, stroke, diabetes and some cancers)
Proper nutrition is key to preventing a number of diseases. Nutrients are necessary to feed every cell and ensure all body systems are functioning properly. Testing can help clinicians and patients gain an understanding of how nutritional imbalances may be impacting their health. Certain conditions or dietary, genetic, and lifestyle factors may predispose a person to having nutrient imbalances.
Symptoms and conditions associated with nutrient imbalances
- Mood disorders2-5
- Cardiovascular disease6,7
- Obesity/ Insulin resistance/ Type 2 Diabetes8-11
- Autism12-15
- Fatigue16-19
- Weight Issues/ Malnutrition/ Dietary Guidance
- Maldigestion/Malabsorption
- Increased nutrient demand in physical trauma/healing20
The NutrEval FMV Biomarkers
The biomarkers on the NutrEval are arranged as follows (see sample report for individual analytes):
- Organic Acids (urine)
- Malabsorption Dysbiosis Markers are metabolites produced by the gastrointestinal microbiome
- Cellular Energy & Mitochondrial Markers are biomarkers of carbohydrate and fatty acid metabolism, and the citric acid (Kreb's) cycle
- Vitamin Markers are specific analytes used to assess functional levels of vitamin cofactors
- Neurotransmitter Metabolites are downstream byproducts of epinephrine, norepinephrine, serotonin and dopamine
- Toxin & Detoxification Markers relate to certain toxic metabolites and the body's detoxification capacity
- NEW Oxalate Markers relate to kidney stone formation, oxidative stress and metabolic dysfunction
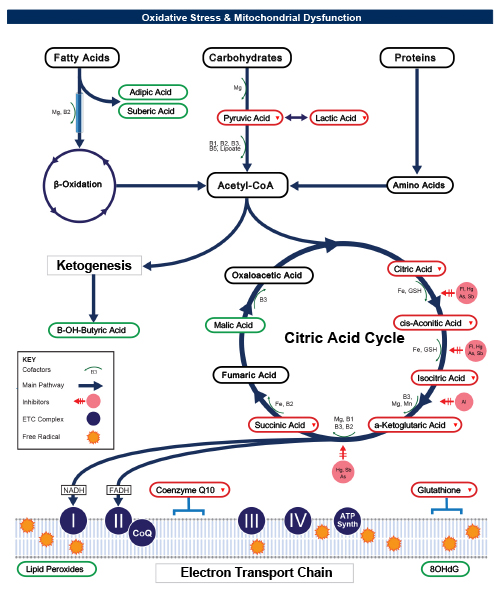
- Oxidative Stress Markers include antioxidants glutathione (whole blood) and Coenzyme Q10 (serum), as well as the oxidative damage markers lipid peroxides and 8-OHdG (urine)
- Amino Acids (urine)
- Essential Amino Acids must be derived from dietary sources
- Nonessential Amino Acids are synthesized by the body
- Intermediary Metabolites are byproducts of amino acid metabolism
- B Vitamin Markers are involved in biochemical reactions that specifically require B vitamins
- Urea Cycle Markers are byproducts associated with nitrogen detoxification
- Glycine/Serine Metabolites are involved in the choline to acetylcholine (neurotransmitter) pathway and the methylation pathways
- Dietary Peptide Related Markers can indicate incomplete protein breakdown
- Essential and Metabolic Fatty Acids Markers (RBCs)
- Omega 3 Fatty Acids are essential for brain function and cardiovascular health and are anti-inflammatory
- Omega 6 Fatty Acids are involved in the balance of inflammation
- Omega 9 Fatty Acids are important for brain growth, nerve cell myelin, and reducing inflammation
- Saturated Fatty Acids are involved in liproprotein metabolism and adipose tissue inflammation
- Monounsaturated Fats include omega 7 fats and unhealthy trans fats
- Delta-6 Desaturase Activity assesses efficiency of this enzyme to metabolize omega 6's and omega 3's
- Cardiovascular Risk includes specific ratios and the Omega 3 Index
- Elemental Markers
- Nutrient Elements are direct measurements of copper and zinc (plasma), magnesium and potassium (RBC), and manganese and selenium (whole blood)
- Toxic Elements (whole blood) indicate exposure to lead, mercury, arsenic, or cadmium within approximately a 90-120 day timeframe
- Add-on Vitamin D (serum) measures a total of 25-hydroxyvitamin D3 (cholecalciferol) and 25-hydroxyvitamin D2 (ergocalciferol)
- Add-on Genomic SNPs (buccal swab) include MTHFR, COMT, TNF-a, and APOE
Watch the NutrEval Report Review Now
What is the difference between plasma and urine amino acids?
Certain amino acids are measurable in blood versus urine and sample type selection depends on the clinical concern. The key differences between plasma and urine amino acids are summarized below.21,22
| Plasma Amino Acids (Fasting) | Urine Amino Acids (First Morning Void) |
| Fasting sample represents "steady state" pool of amino acids; not affected by short-term diet fluctuations | Represents recent dietary intake and metabolism - more variable compared to plasma |
| 36 analytes | 40 analytes |
| Useful for mood disorders, or uncontrolled diets | Useful for controlled diets, to assess protein maldigestion, oxidative stress, vitamin/mineral cofactors affecting amino acid metabolism |
| Amino acid levels influenced by abnormal kidney function; preferred if patient has proteinuria | Amino acid levels influenced by abnormal kidney function; urine testing dependent on healthy kidney function (biomarkers ratioed to urine creatinine) |
| Requires a blood draw | Requires a urine sample |
What advantage does the NutrEval FMV offer compared to other diagnostics?
The NutrEval FMV is one of the most comprehensive nutritional profiles available assessing a broad array of macronutrients and micronutrients, as well as markers that give insight into digestive function, toxic exposure, mitochondrial function, and oxidative stress.
Genova provides a user-friendly report with clinically actionable results including:
- Suggested digestive support and vitamin, mineral, amino acid, and fatty acid recommendations based on an algorithmic calculation of functional need for cofactors in the body's metabolism
- Functional pillars with a built-in scoring system to guide therapy for methylation support, toxic exposures, mitochondrial dysfunction, fatty acid imbalances, and oxidative stress
- Interpretation-At-A-Glance pages provide educational information on nutrient function, causes and complications of deficiencies, and dietary sources
A Functional Nutritional Assessment
There are various methods of assessing nutrient status, including intracellular and extracellular direct measurement, and measuring biochemical pathway markers that require specific nutrient cofactors for proper metabolism. The NutrEval uses a combination of these methods and synthesizes the information via an algorithm that determines personalized nutrient needs. The algorithm is based on functional markers shown in the literature to be associated with a need for a particular nutrient.
Functional evaluation of nutritional status assesses metabolic intermediates produced in enzymatic pathways of cellular energy production, detoxification, neurotransmitter breakdown, and amino acid metabolism. Specific metabolites outside of reference range may signal a metabolic inhibition or block. This abnormality may be due to a nutrient deficiency, an inherited enzyme deficit, toxic build-up, or drug effect. It is possible for an individual to have normal blood levels of a vitamin in order to maintain homeostasis, while exhibiting signs of insufficiency/deficiency for that vitamin. For this reason, direct testing of individual nutrients alone does not provide a complete picture.
Other methods of assessing nutrient status, such as intracellular lymphocyte testing, has limited literature support.
Conventional nutritional panels include tests such as complete blood count, comprehensive metabolic panel, iron, ferritin and other select nutrients. The NutrEval is not meant to be a substitute for this important testing, but rather a complement by providing additional information.
What can clinicians and patients expect from NutrEval FMV testing?
Personalized recommendations for amino acids, fatty acids, vitamins, minerals, digestive support, and other nutrients are provided for each patient. Additionally, exposure to select toxic substances and oxidative stressors may need to be addressed. Comprehensive stool testing or SIBO breath testing may be appropriate to investigate the possible cause for maldigestion/malabsorption and dysbiosis.
Genova's Methodology
Urinary organic and amino acids are measured via GCMS, LC/MS/MS and alkaline picrate. Fatty acids are measured via GCMS. Urinary oxidative stress markers are measured using colorimetric, thiobarbituric acid reactive substances (TBARS) and LC/MS/MS. CoQ10 is measured via HPLC. Glutathione is measured using colorimetric. Nutrient and toxic elements are measured using ICP-MS and Kinetic (Jaffe). Reference ranges are age and gender specific and are based on a questionnaire-qualified healthy cohort. Testing is not performed in patients under 2 years old.
References
- WHO. Malnutrition. Fact sheets 2018; Accessed April 15, 2019.
- Su KP, Matsuoka Y, Pae CU. Omega-3 Polyunsaturated Fatty Acids in Prevention of Mood and Anxiety Disorders. Clinical psychopharmacology and neuroscience : the official scientific journal of the Korean College of Neuropsychopharmacology. 2015;13(2):129-137.
- Grosso G, Galvano F, Marventano S, et al. Omega-3 fatty acids and depression: scientific evidence and biological mechanisms. Oxidative medicine and cellular longevity. 2014;2014:313570.
- Smith MA, Beilin LJ, Mori TA, Oddy WH. Essential fatty acids and mood: a systematic review of observational studies. 2011;1(1):14-27.
- Chen JJ, Bai SJ, Li WW, et al. Urinary biomarker panel for diagnosing patients with depression and anxiety disorders. Translational psychiatry. 2018;8(1):192.
- Zheng P, Chen JJ, Huang T, et al. A novel urinary metabolite signature for diagnosing major depressive disorder. Journal of proteome research. 2013;12(12):5904-5911.
- Wijendran V, Hayes KC. Dietary n-6 and n-3 fatty acid balance and cardiovascular health. Annual review of nutrition. 2004;24:597-615
- Shimizu M, Miyazaki T, Takagi A, et al. Low circulating coenzyme Q10 during acute phase is associated with inflammation, malnutrition, and in-hospital mortality in patients admitted to the coronary care unit. Heart and vessels. 2017;32(6):668-673.
- Giesbertz P, Daniel H. Branched-chain amino acids as biomarkers in diabetes. Current opinion in clinical nutrition and metabolic care. 2016;19(1):48-54.
- Adams SH. Emerging perspectives on essential amino acid metabolism in obesity and the insulin-resistant state. Advances in nutrition (Bethesda, Md). 2011;2(6):445-456.
- Durá-Travé T, Gallinas-Victoriano F, Cortes-Castell E, Moya-Benavent M. Amino Acid Plasma Concentrations and Urinary Excretion in Young Diabetics. In: Diabetes and Its Complications. IntechOpen; 2017.
- Simopoulos AP. An Increase in the Omega-6/Omega-3 Fatty Acid Ratio Increases the Risk for Obesity. Nutrients. 2016;8(3):128.
- Liu A, Zhou W, Qu L, et al. Altered Urinary Amino Acids in Children With Autism Spectrum Disorders. Frontiers in cellular neuroscience. 2019;13:7.
- Li C, Shen K, Chu L, Liu P, Song Y, Kang X. Decreased levels of urinary free amino acids in children with autism spectrum disorder. Journal of clinical neuroscience : official journal of the Neurosurgical Society of Australasia. 2018;54:45-49.
- Kaluzna-Czaplinska J, Jozwik-Pruska J, Chirumbolo S, Bjorklund G. Tryptophan status in autism spectrum disorder and the influence of supplementation on its level. Metabolic brain disease. 2017;32(5):1585-1593.
- Kaluzna-Czaplinska J. Noninvasive urinary organic acids test to assess biochemical and nutritional individuality in autistic children. Clinical biochemistry. 2011;44(8-9):686-691.
- Dunstan RH, Sparkes DL, Macdonald MM, et al. Diverse characteristics of the urinary excretion of amino acids in humans and the use of amino acid supplementation to reduce fatigue and sub-health in adults. Nutrition journal. 2017;16(1):19.
- Hugh Dunstan R, Sparkes DL, Macdonald MM, et al. Altered amino acid homeostasis and the development of fatigue by breast cancer radiotherapy patients: A pilot study. Clinical biochemistry. 2011;44(2-3):208-215.
- Niblett SH, King KE, Dunstan RH, et al. Hematologic and urinary excretion anomalies in patients with chronic fatigue syndrome. Experimental biology and medicine (Maywood, NJ). 2007;232(8):1041-1049.
- Nozaki S, Tanaka M, Mizuno K, et al. Mental and physical fatigue-related biochemical alterations. Nutrition (Burbank, Los Angeles County, Calif). 2009;25(1):51-57.
- Reddell L, Cotton BA. Antioxidants and micronutrient supplementation in trauma patients. Current opinion in clinical nutrition and metabolic care. 2012;15(2):181-187.
- Broer S, Broer A. Amino acid homeostasis and signalling in mammalian cells and organisms. The Biochemical journal. 2017;474(12):1935-1963.
- Duranton F, Lundin U, Gayrard N, et al. Plasma and urinary amino acid metabolomic profiling in patients with different levels of kidney function. Clinical journal of the American Society of Nephrology : CJASN. 2014;9(1):37-45.
| Analyte List |
|---|
| 1-Methylhistidine |
| 2-Hydroxyphenylacetic Acid |
| 3-Hydroxyproprionic Acid |
| 3-Methyl-4-OH-phenylglycol |
| 3-Methylhistidine |
| 4-Hydroxyphenylpyruvic Acid |
| 5-OH-Indoleacetic Acid |
| 8-OHdG |
| Adipic Acid |
| Alanine |
| Alpha-amino-N-butyric acid |
| Alpha-aminoadipic acid |
| Anserine (dipeptide) |
| Arachidic |
| Arachidonic |
| Arginine |
| Arsenic |
| Asparagine |
| Aspartic acid |
| Behenic |
| Benzoic |
| Benzoic/Hippuric Acids Ratio |
| Beta-alanine |
| Beta-aminoisobutyric acid |
| Cadmium |
| Carnosine (dipeptide) |
| Cis-Aconitic Acid |
| Citramalic Acid |
| Citric Acid |
| Citrulline |
| CoQ10 |
| Copper |
| Creatinine |
| Cystathionine |
| Cysteine |
| Cystine |
| D-Arabinitol |
| Dihomo-gamma-linolenic |
| Dihydroxyphenylpropionic Acid |
| Docosahexaenoic |
| Docosapentaenoic |
| Docosatetraenoic |
| Eicosadienoic |
| Eicosapentaenoic |
| Elaidic |
| Ethanolamine |
| Formiminoglutamic Acid (FIGlu) |
| Gamma-Linolenic |
| Gamma-aminobutyric acid |
| Glucose |
| Glutamic acid |
| Glutamine |
| Glutaric Acid |
| Glutathione |
| Glyceric Acid |
| Glycine |
| Glycolic Acid |
| Hippuric |
| Histidine |
| Homovanillic Acid |
| Indoleacetic Acid |
| Isocitric Acid |
| Isoleucine |
| Kynurenic Acid |
| Lactic Acid |
| Lead |
| Leucine |
| Lignoceric |
| Linoleic |
| Lipid Peroxides |
| Lysine |
| Magnesium |
| Malic Acid |
| Manganese |
| Margaric |
| Mercury |
| Methionine |
| Methylmalonic Acid |
| Nervonic |
| Oleic |
| Ornithine |
| Orotic Acid |
| Oxalic Acid |
| Palmitic |
| Palmitoleic |
| Pentadecanoic |
| Phenylacetic Acid |
| Phenylalanine |
| Phosphoethanolamine |
| Phosphoserine |
| Potassium |
| Proline |
| Pyroglutamic Acid |
| Pyruvic Acid |
| Sarcosine |
| Selenium |
| Serine |
| Stearic |
| Suberic Acid |
| Succinic Acid |
| Taurine |
| Threonine |
| Tricosanoic |
| Tryptophan |
| Urea |
| Vaccenic |
| Valine |
| Vanilmandelic Acid |
| Zinc |
| a-Keto-b-Methylvaleric Acid |
| a-Ketoadipic Acid |
| a-Ketoglutaric Acid |
| a-Ketoisocaproic Acid |
| a-Ketoisovaleric Acid |
| a-hydroxybutyrate |
| alpha-Linolenic |
| b-OH-Butyric Acid |
| b-OH-b-Methylglutaric Acid |
| CPT Codes | |
|---|---|
| 1-Methylhistidine | 82139 |
| 2-Hydroxyphenylacetic Acid | 83921 |
| 3-Hydroxyproprionic Acid | 83921 |
| 4-Hydroxyphenylpyruvic Acid | 83921 |
| 5-OH-Indoleacetic Acid | 83497 |
| 8-OHdG | 83520 |
| Adipic Acid | 83921 |
| Arachidic | 82542 |
| Behenic | 82726 |
| Cadmium | 82300 |
| Citric Acid | 82507 |
| CoQ10 | 82542 |
| Copper | 82525 |
| Creatinine | 82570 |
| D-Arabinitol | 84311 |
| Docosatetraenoic | 82726 |
| Glutaric Acid | 83921 |
| Glutathione | 82978 |
| Glyceric Acid | 83945 |
| Glycolic Acid | 83945 |
| Homovanillic Acid | 83150 |
| Isocitric Acid | 83921 |
| Lactic Acid | 83605 |
| Lead | 83655 |
| Lignoceric | 82726 |
| Lipid Peroxides | 84311 |
| Magnesium | 83735 |
| Malic Acid | 83921 |
| Manganese | 83785 |
| Methylmalonic Acid | 83921 |
| Nervonic | 82726 |
| Orotic Acid | 83921 |
| Oxalic Acid | 83945 |
| Potassium | 84132 |
| Pyruvic Acid | 84210 |
| Suberic Acid | 83921 |
| Succinic Acid | 83921 |
| Tricosanoic | 82726 |
| Vanilmandelic Acid | 84585 |
| Zinc | 84630 |
| a-Keto-b-Methylvaleric Acid | 83921 |
| a-Ketoadipic Acid | 83921 |
| a-Ketoglutaric Acid | 83921 |
| a-Ketoisocaproic Acid | 83921 |
| a-Ketoisovaleric Acid | 83921 |
| a-hydroxybutyrate | 83921 |
| b-OH-Butyric Acid | 83921 |
| b-OH-b-Methylglutaric Acid | 83921 |
| Specimen Requirements |
|---|
| 1 amber tube – serum (frozen); 1 blue-top Na-Heparin tube or blue-top K2-EDTA - Packed RBCs (refrigerated); 1 red-top neutral tube - serum (frozen); 1 EDTA tube 9mL - whole blood (refrigerated); 1 EDTA tube 4mL - whole blood (refrigerated); 1 green-top preservative tube - FMV urine (frozen); 1 blue-top amber tube - FMV urine (frozen); 1 green-top tube - FMV urine (frozen) |